
How to Troubleshoot Issues
During configuration, you might have difficulties finding the root cause of an issue. Memority provides several features to help you understand and fix your configuration.
Troubleshooting Process
To find the root cause, follow these steps in order:
Step 1: Read the error message
Step 2: Check the audit
Step 3: Check the logs
Step 1: Read the Error Message
If an error occurs, an error message appears. There are two types:
Functional message. A validation rule causes this type of message. It usually means there is a data consistency problem.
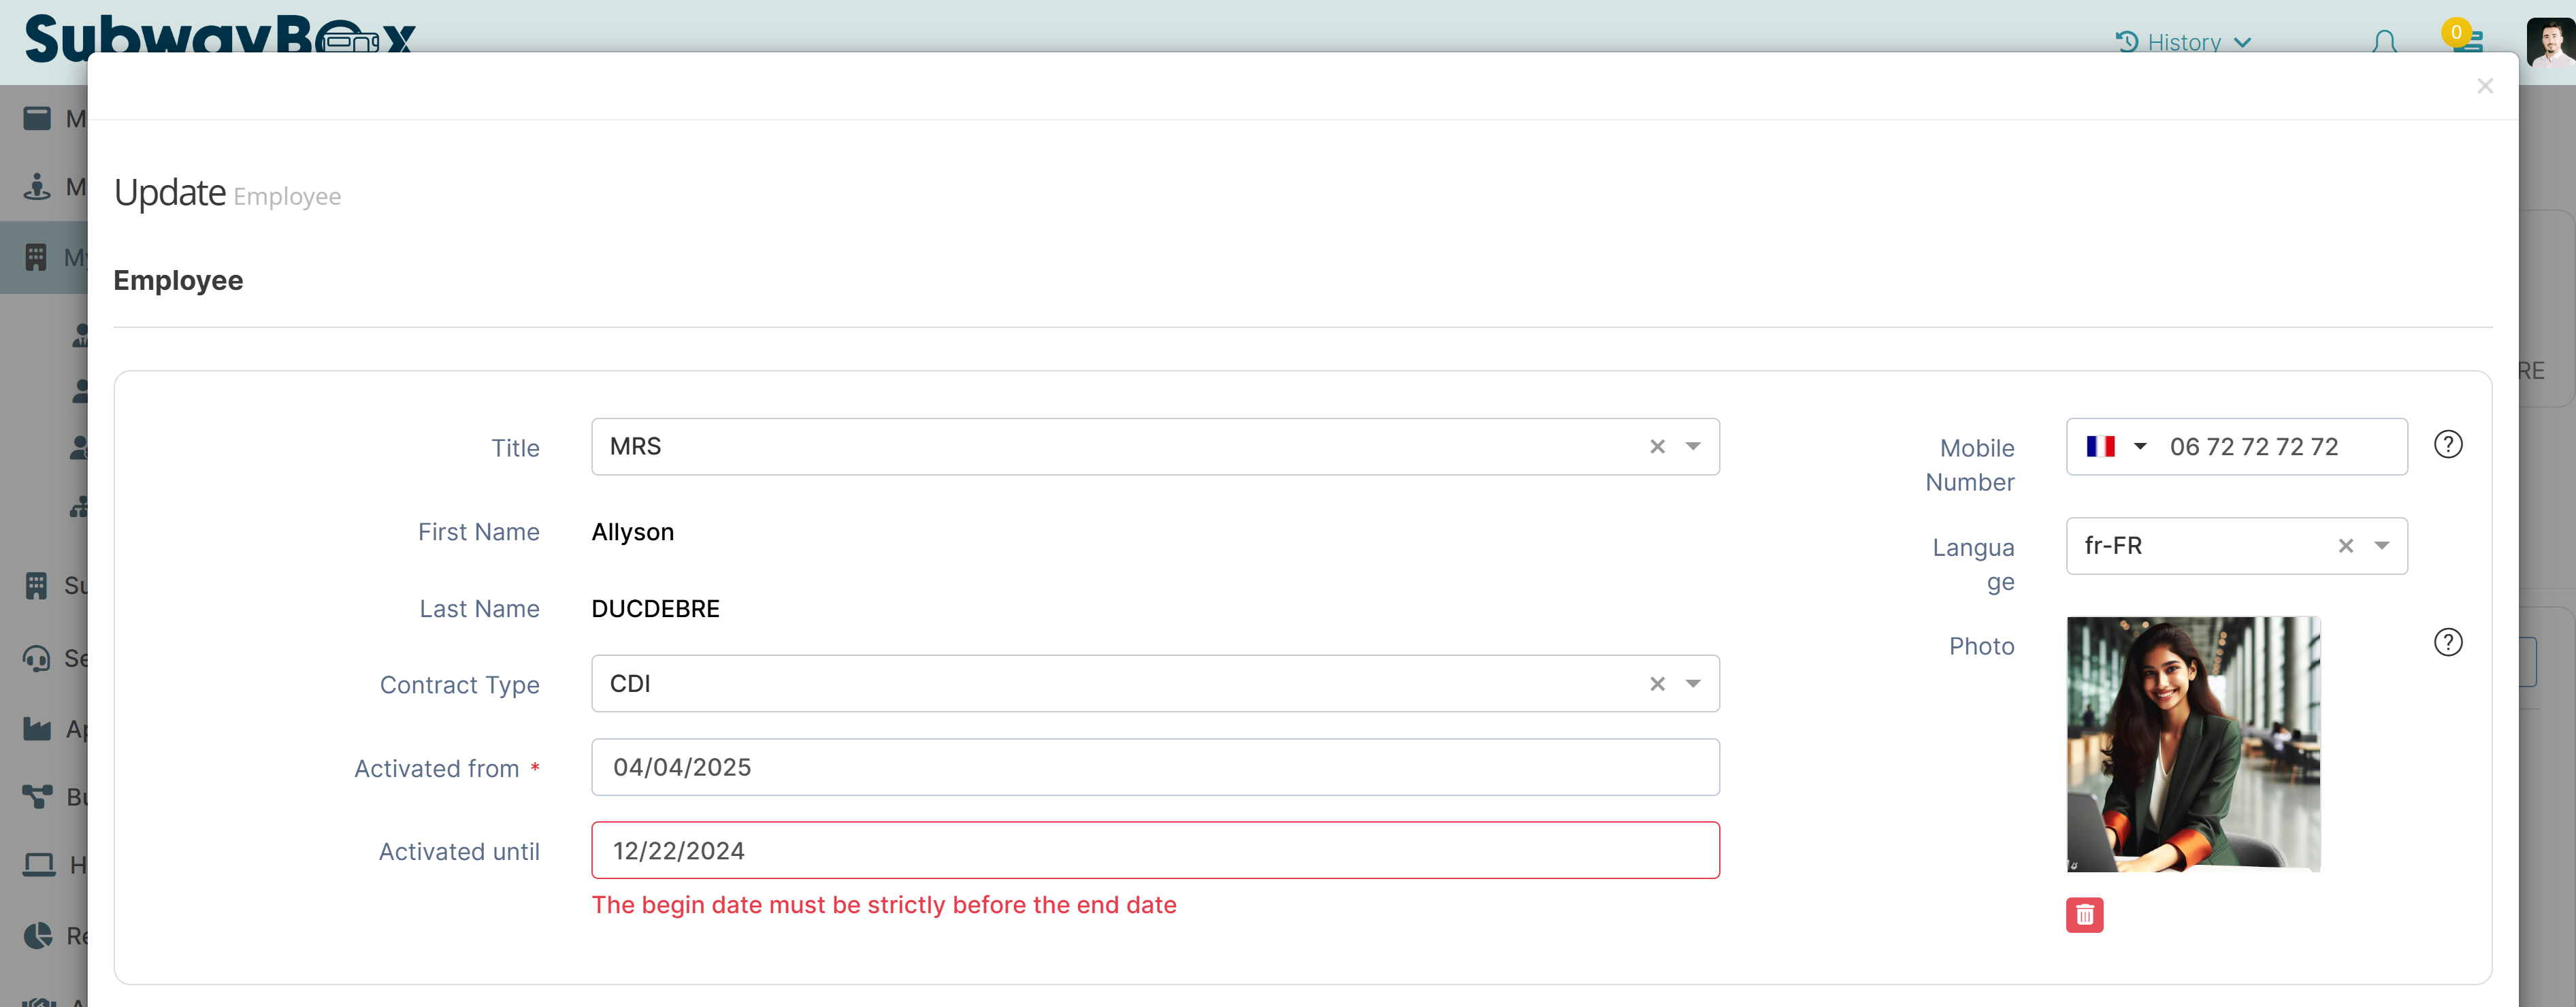
Example of a functional error message
Technical message. A configuration issue usually causes this type of message.
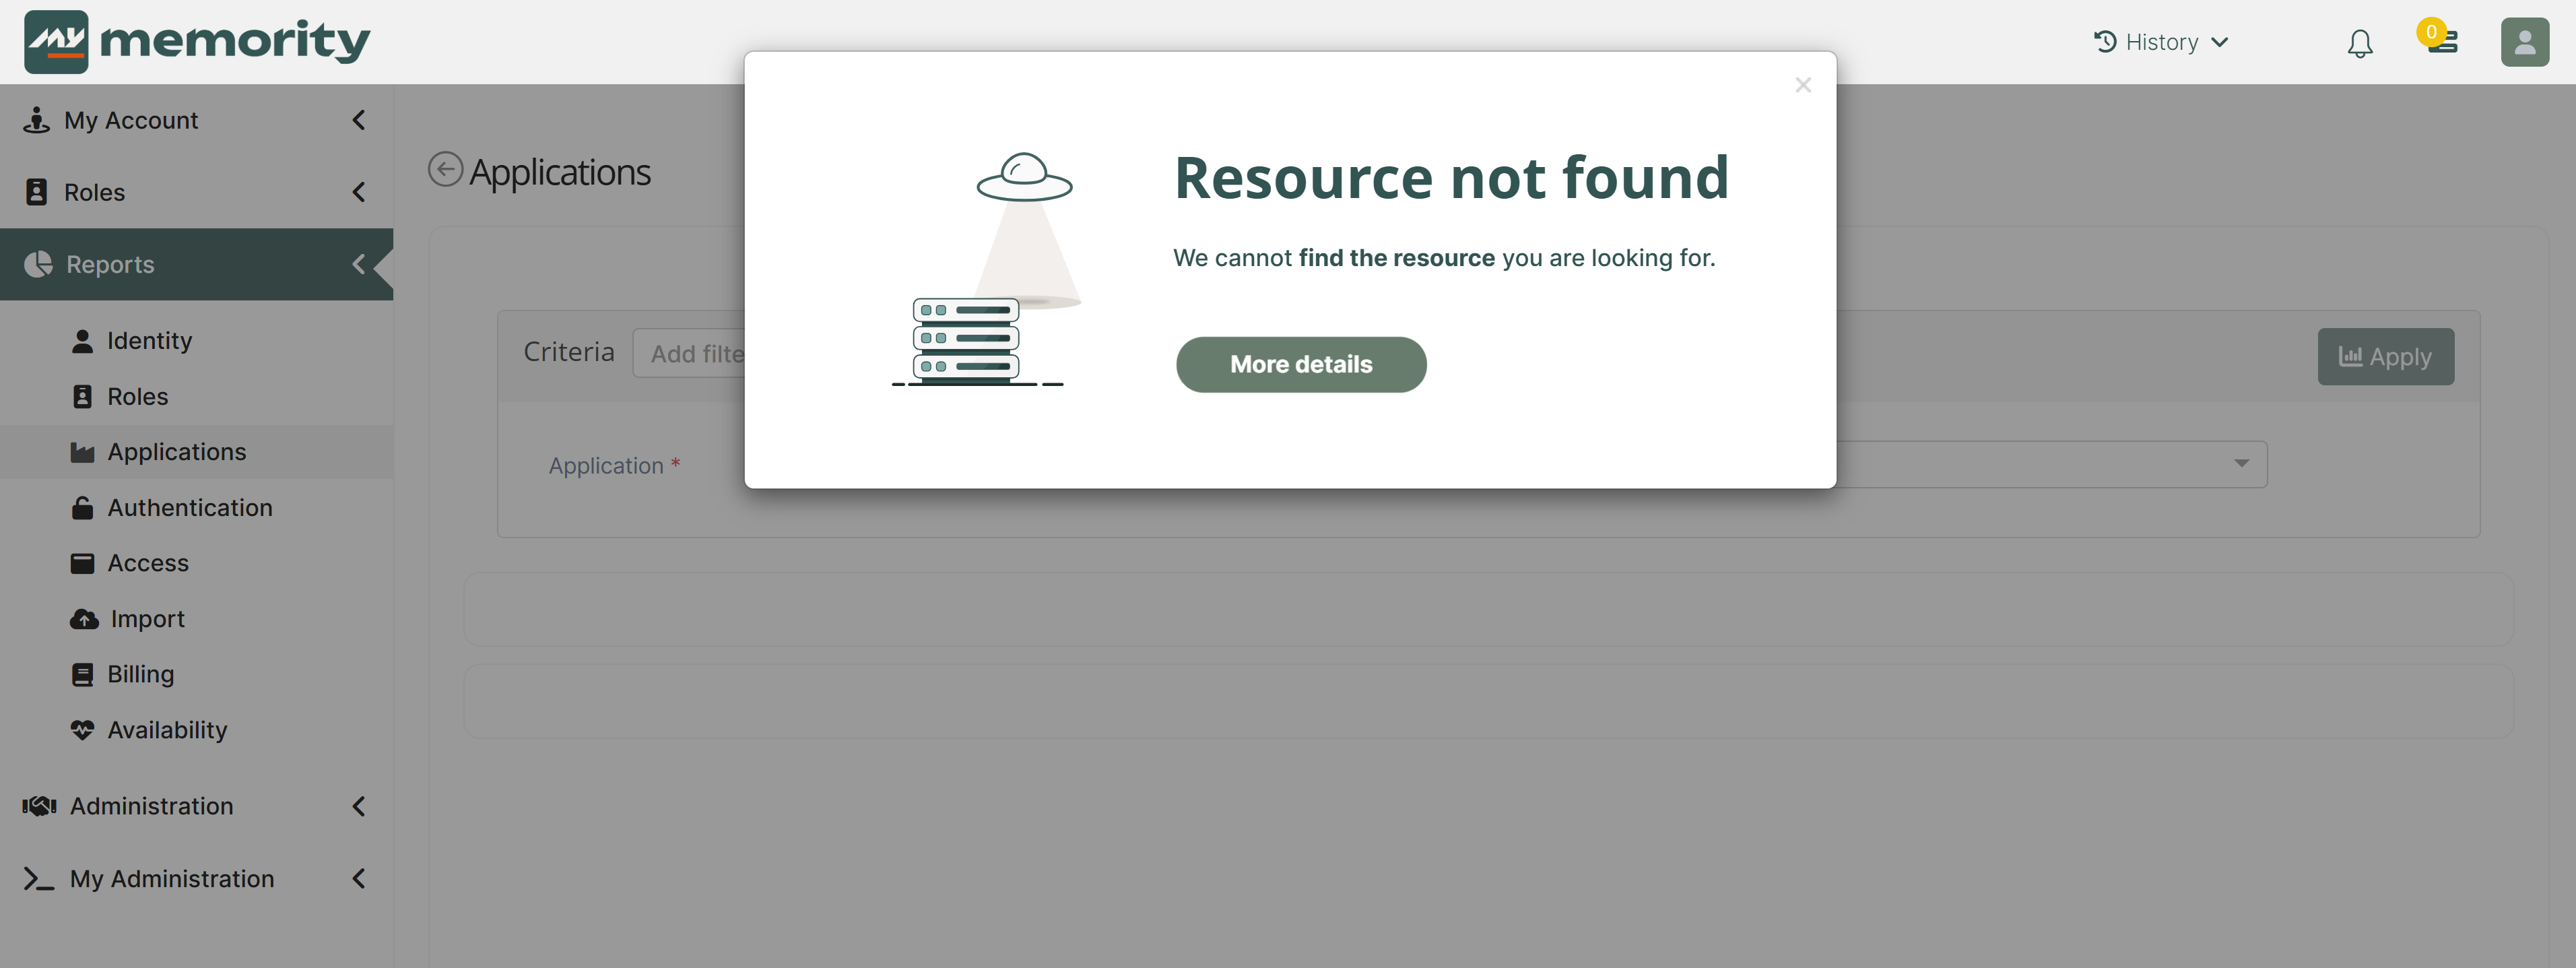
Example of a technical error message
When you get a technical error, click the More details button to see helpful information. Copy this information if you need to share it.
Label: Short error title
Description: Error description with more information
Tracking ID: Unique identifier that links to audit traces for the action
Timestamp: Date and time of the error
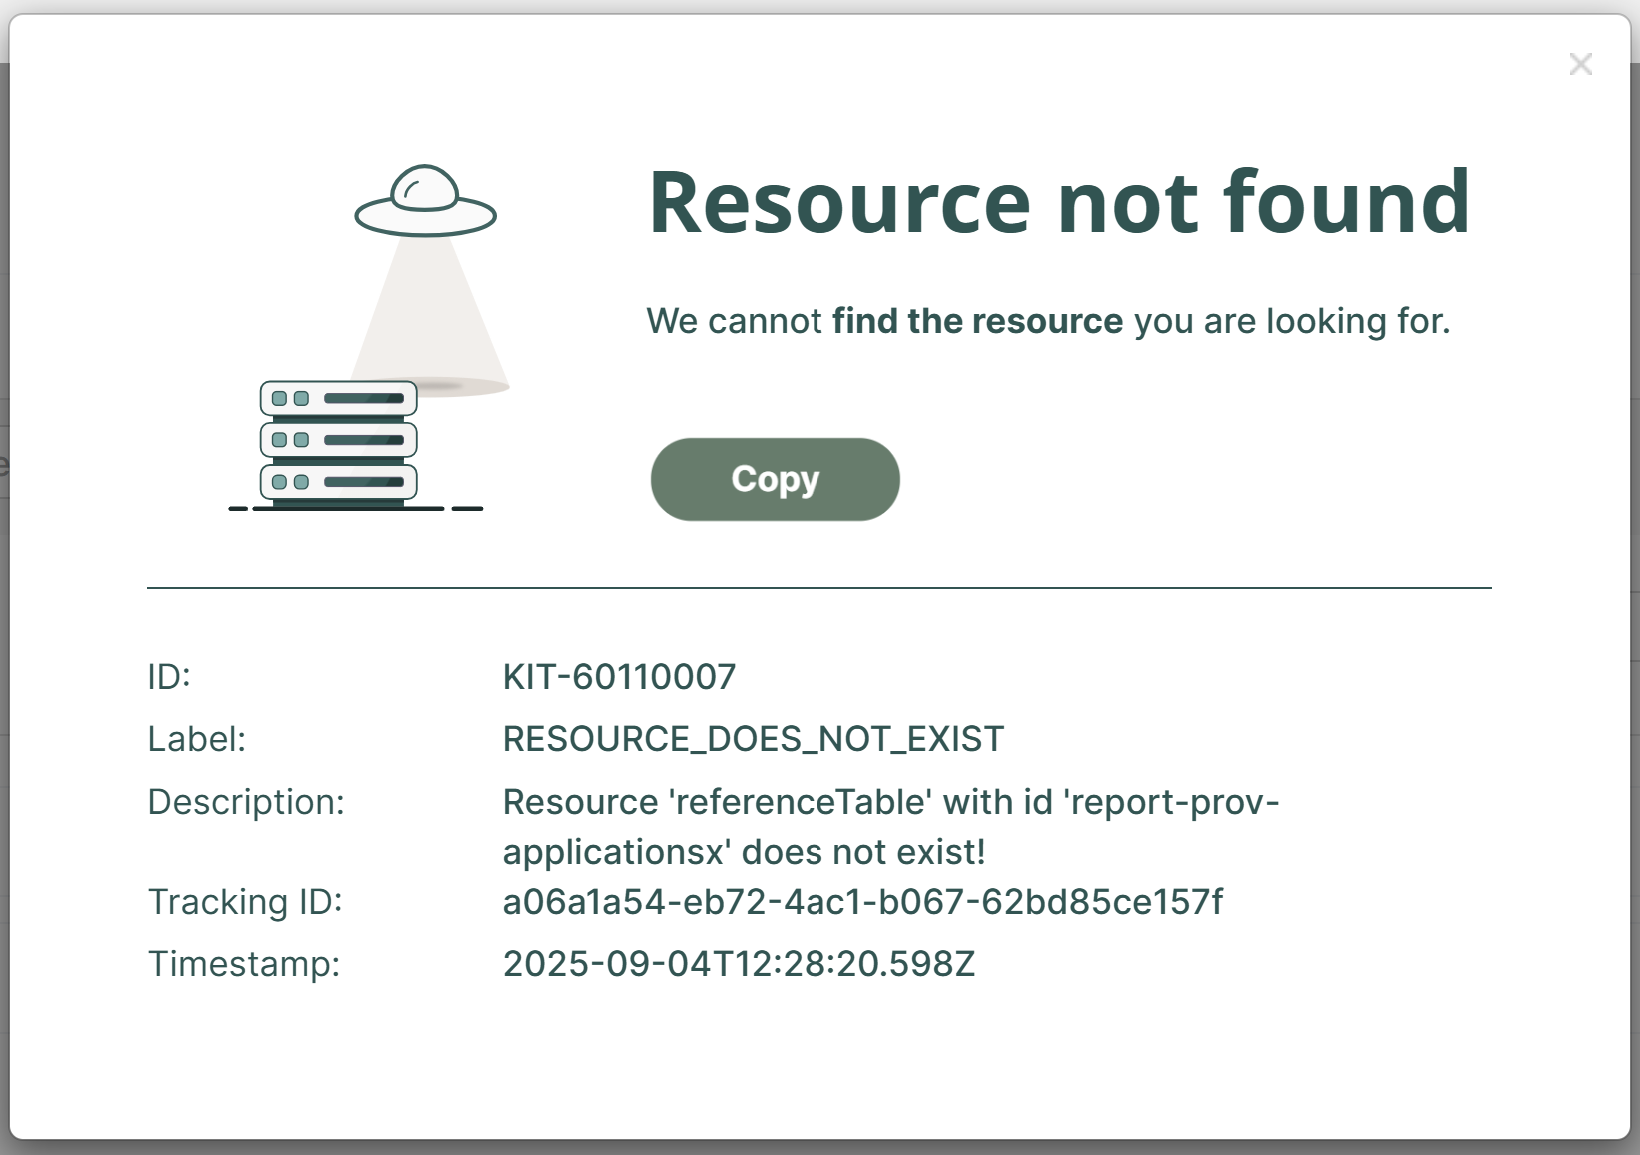
Example of technical error details
Next step: If this information does not help, check the audit.
Step 2: Check the Audit
The audit logs all the actions in the tenant. It tracks changes made by users, administrators, or the system, including object or configuration creation, updates, and deletions.
Use the audit as your main information source when you troubleshoot errors.
For more information about the audit, see the configuration guide.
This chapter focuses on the full audit (available via the administration portal or via the administration menu of the user portal).
For example, it does not cover the cockpit audit displayed on the identity’s cockpit. Both audits display the same level of information but due to the object-centric nature of the cockpit audit, it hides some traces that can be useful for investigations.
We recommend to use the full audit for advanced investigations.
You can also access the audit through Memority APIs by retrieving it in Postman collection in our documentation.
Access
You can open the audit log from:
User portal → Administration → Audit (unless you modified presets)
Administration portal → System → Audit
Both display the same information in the same format.
By default, the audit log displays the last 24 hours of activity.
Filter
To retrieve easily an action, use filters. Memority combines all the filters with a logical AND to filter the audit events.
For example, if you filter by:
Date = In last 7 days
Actor = User123
Outcome = Failure
The filtered results will include only the failed actions by user123 within the last 7 days.
To add a filter:
Select Add Filter…
Choose one or more filter types
Enter a value for each filter
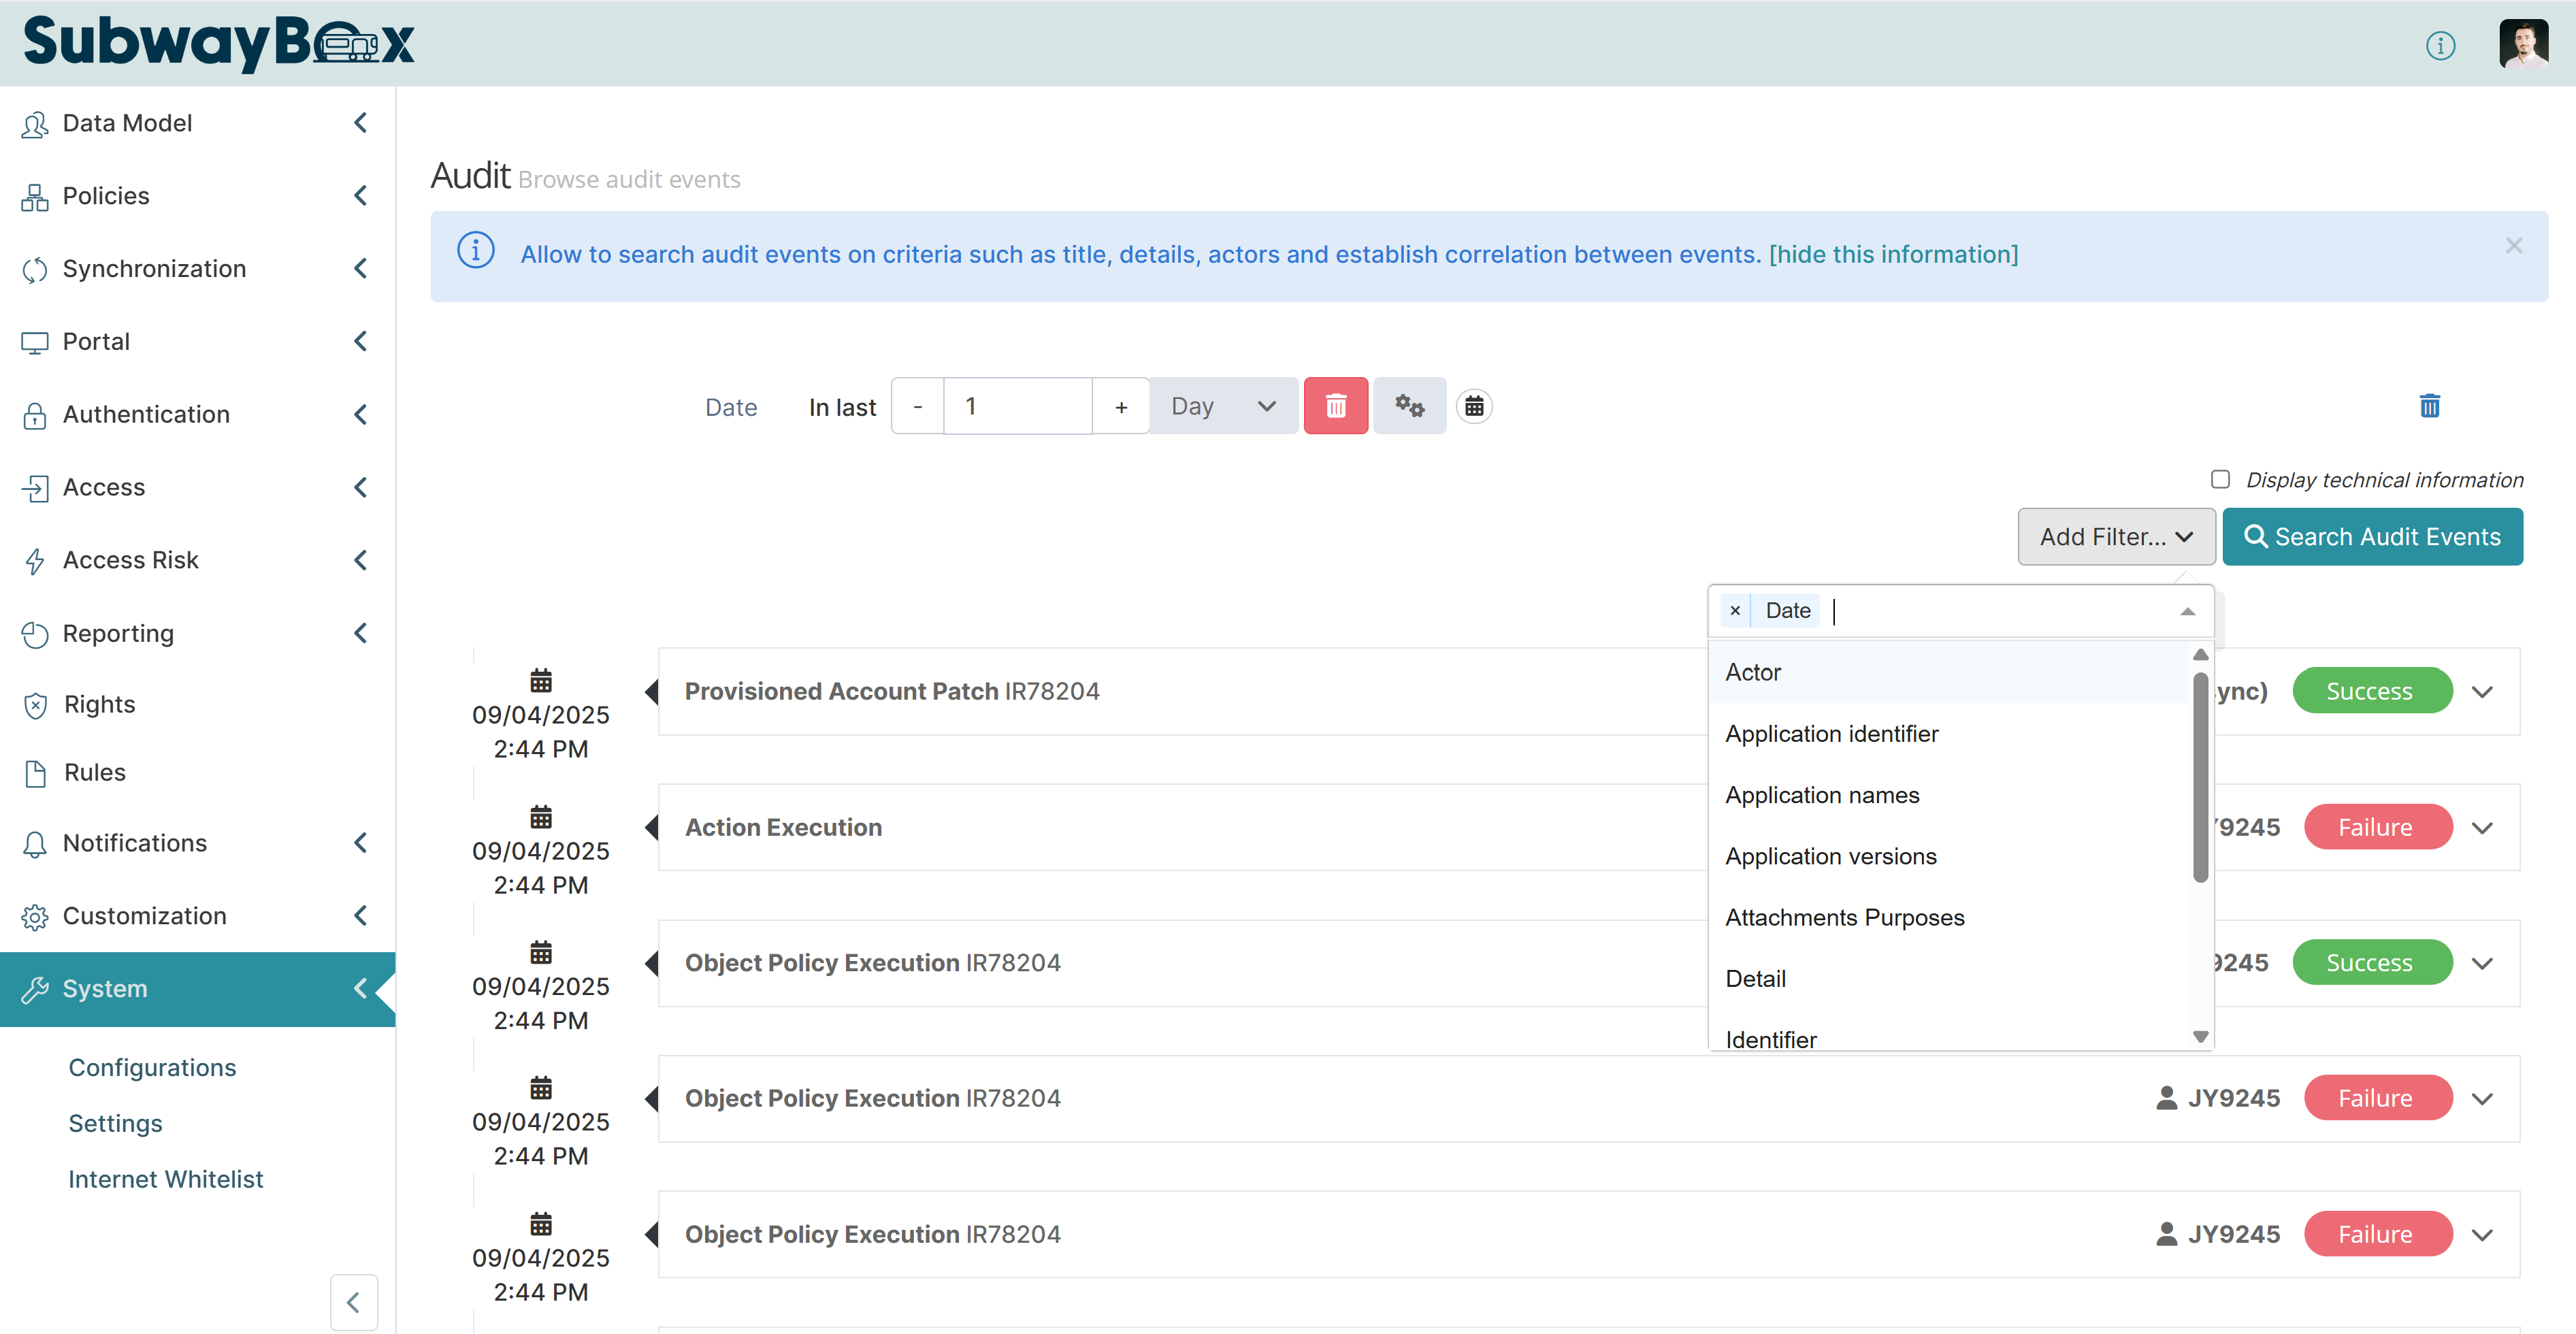
Adding filters to an audit query
The table below lists some useful filters and how to use them:
Filter | Format | Description | |
|---|---|---|---|
Date | Period | Choose a time frame for the filter. You can select a range (from seconds to years in the past) up to the current moment, or specify exact dates. | 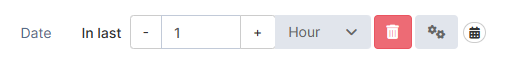 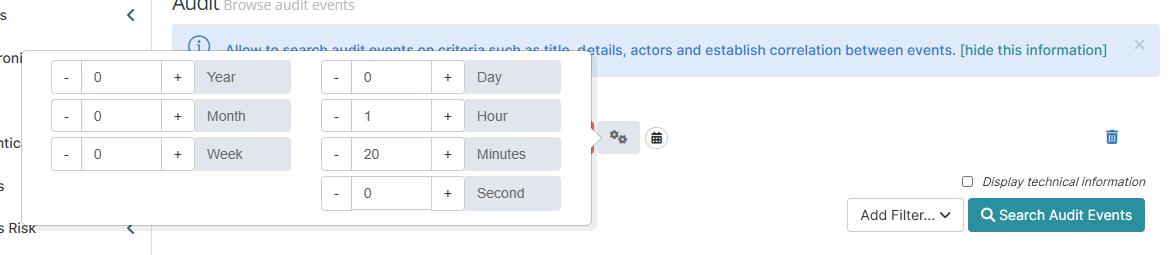 |
Date | Interval | To set a date interval, click the calendar button and choose the start and end dates. | 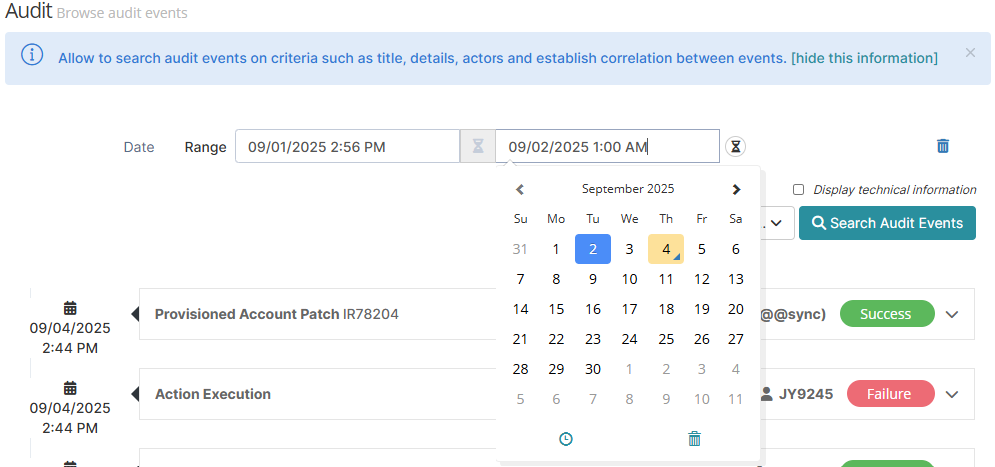 |
Actor | User identifier | Enter a user’s ID to see all audit items involving that user. Optionally, use the drop-down list to specify the user’s role (for example, beneficiary or requester). | 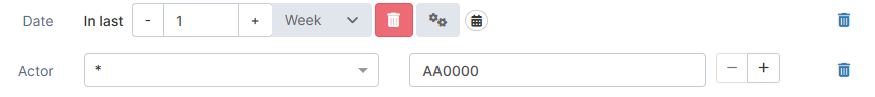 |
Titles | Audit titles | Select one or more audit titles to filter results. | 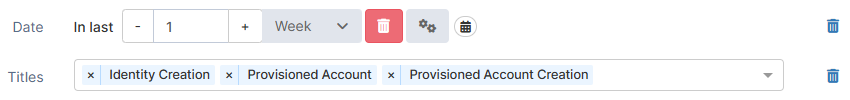 |
Outcomes | Boolean | Filter results by outcome: success or failure. | 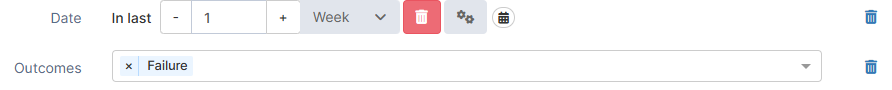 |
Trackings | UUID | Enter the UUID of a tracking ID (log ID, policy execution, or other). | 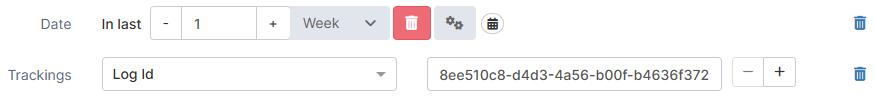 |
Details | String | Filter on any information in an audit item. Select an attribute and a value you would like to search for. Since this kind of search can take a long time, make sure you use a precise date filter to narrow the results and improve the request. | 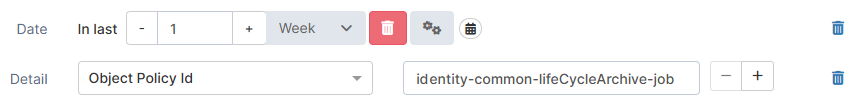 |
Information
Memority audit events include the following details (see the screenshot below):
1. Operator: Unique user ID and the associated full name.
2. Timestamp: Date, time and timezone of the action.
3. Change type: Indicates the type of transaction, such as insert, inactivate, or modify.
4. Record ID: Record identification, including the tracking IDs that will link all the action-related events.
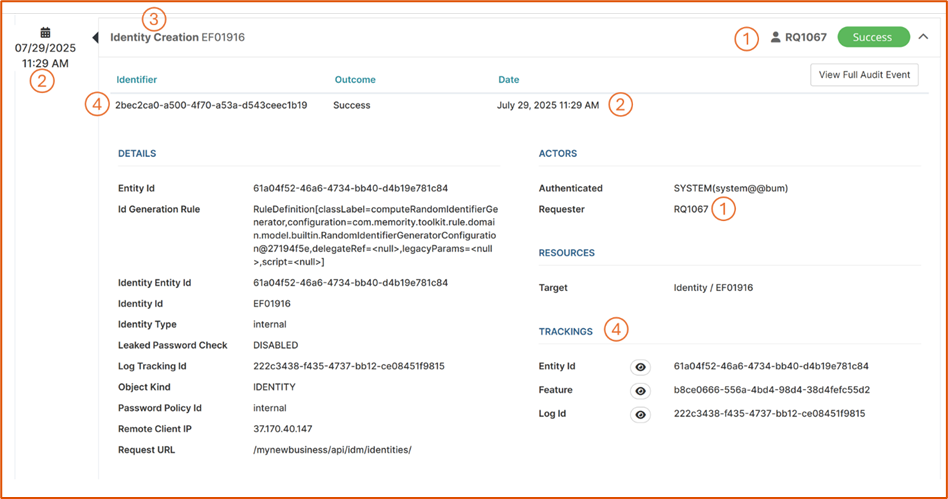
Example of an audit event
Access more details in the full audit event. You can open it using the View Full Audit Event button in the top right corner of the screenshot above.
The full audit event includes additional information, such as:
2. Timestamp: Date, time and time zone of the action.
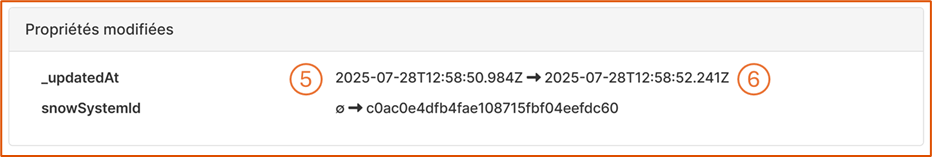
5. New value: Record value after the change.
6. Old value: Record value before the change.
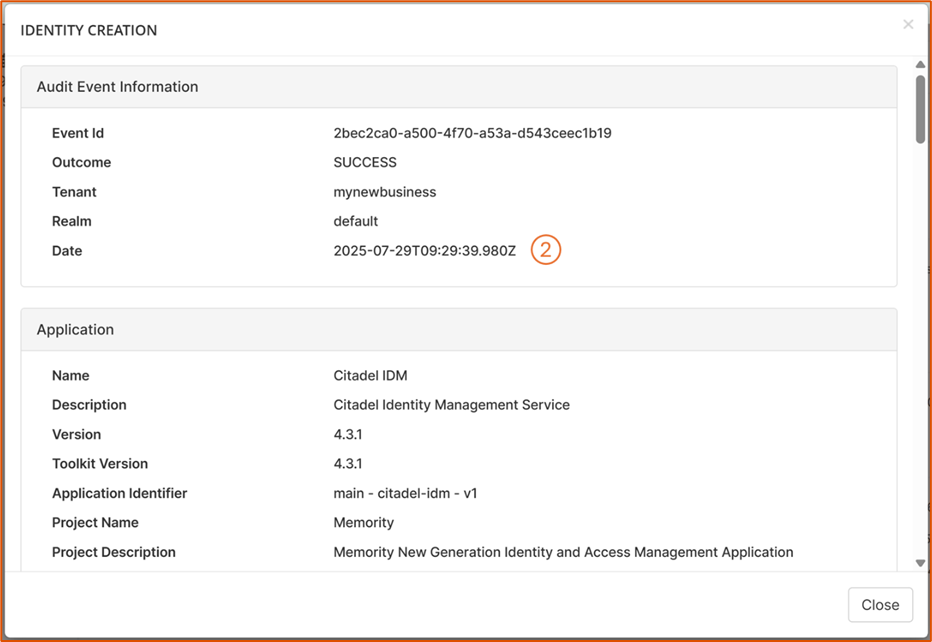
Example of a full audit event
In certain cases, such as provisioning errors or role assignmenst, the full audit can provide more information:
Configuration used for the action.
Error returned by the application.
Comment explaining the change.
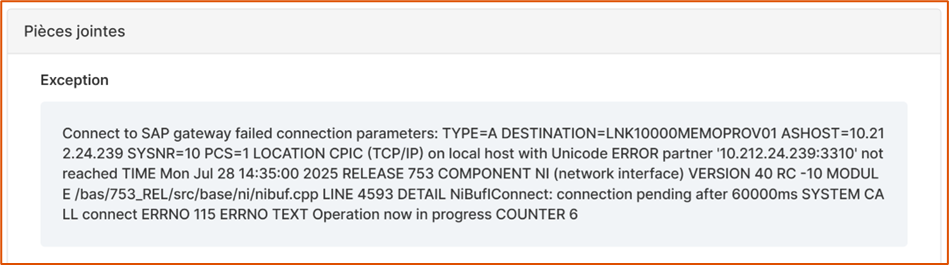
Example of an error message raised by the SAP connector during account provisioning
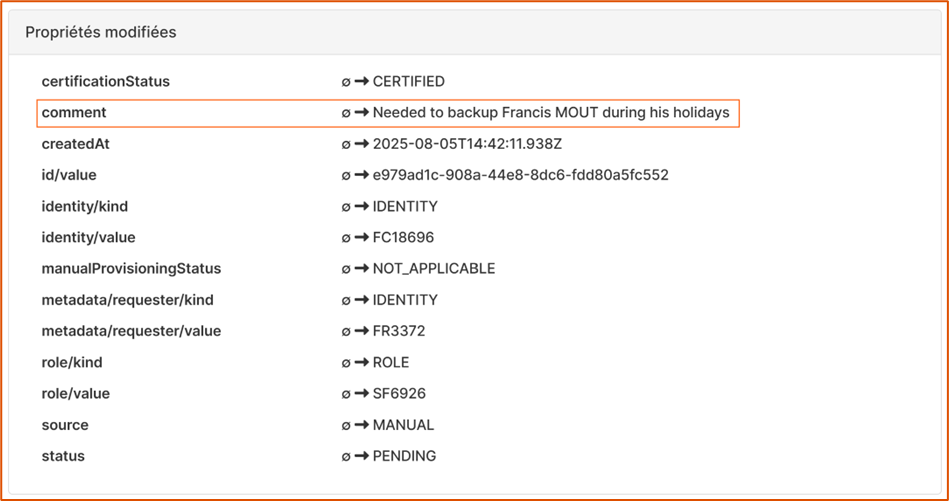
Example of a meaning message in a role assignment request
If the audit information does not help you understand the issue, review the logs.
Step 3: Check the Logs
Integrators define the logs in any configured Groovy hook (for example, policies, import, provisioning or attribute compute rules).
Definition
You can write the logs with the LOG binding. For more details, check the documentation.
There are two types of logs:
Generic log. Adds information to the log feature at a certain level. For example,
LOG.debug.Audit log. Adds information to the audit action. The audit log is useful to send the details to the support team. For example,
LOG.audit.
We recommend using only Debug and Trace detail levels.
Activation
You can activate the logs service per service by using the following setting:
%SERVICE%.app-logs.level.rule.levelLogs remain active for an hour.
Services that support logs:
IDM - Attribute rules, object policies and life cycle policies
BUM - Business policies
SYNC - Import and provisioning
Access - Authentication and federation
RBA - Risk computation rules
To activate logs, select the level of logging detail you want to see in the log feature.
We recommend using only Debug and Trace detail levels.
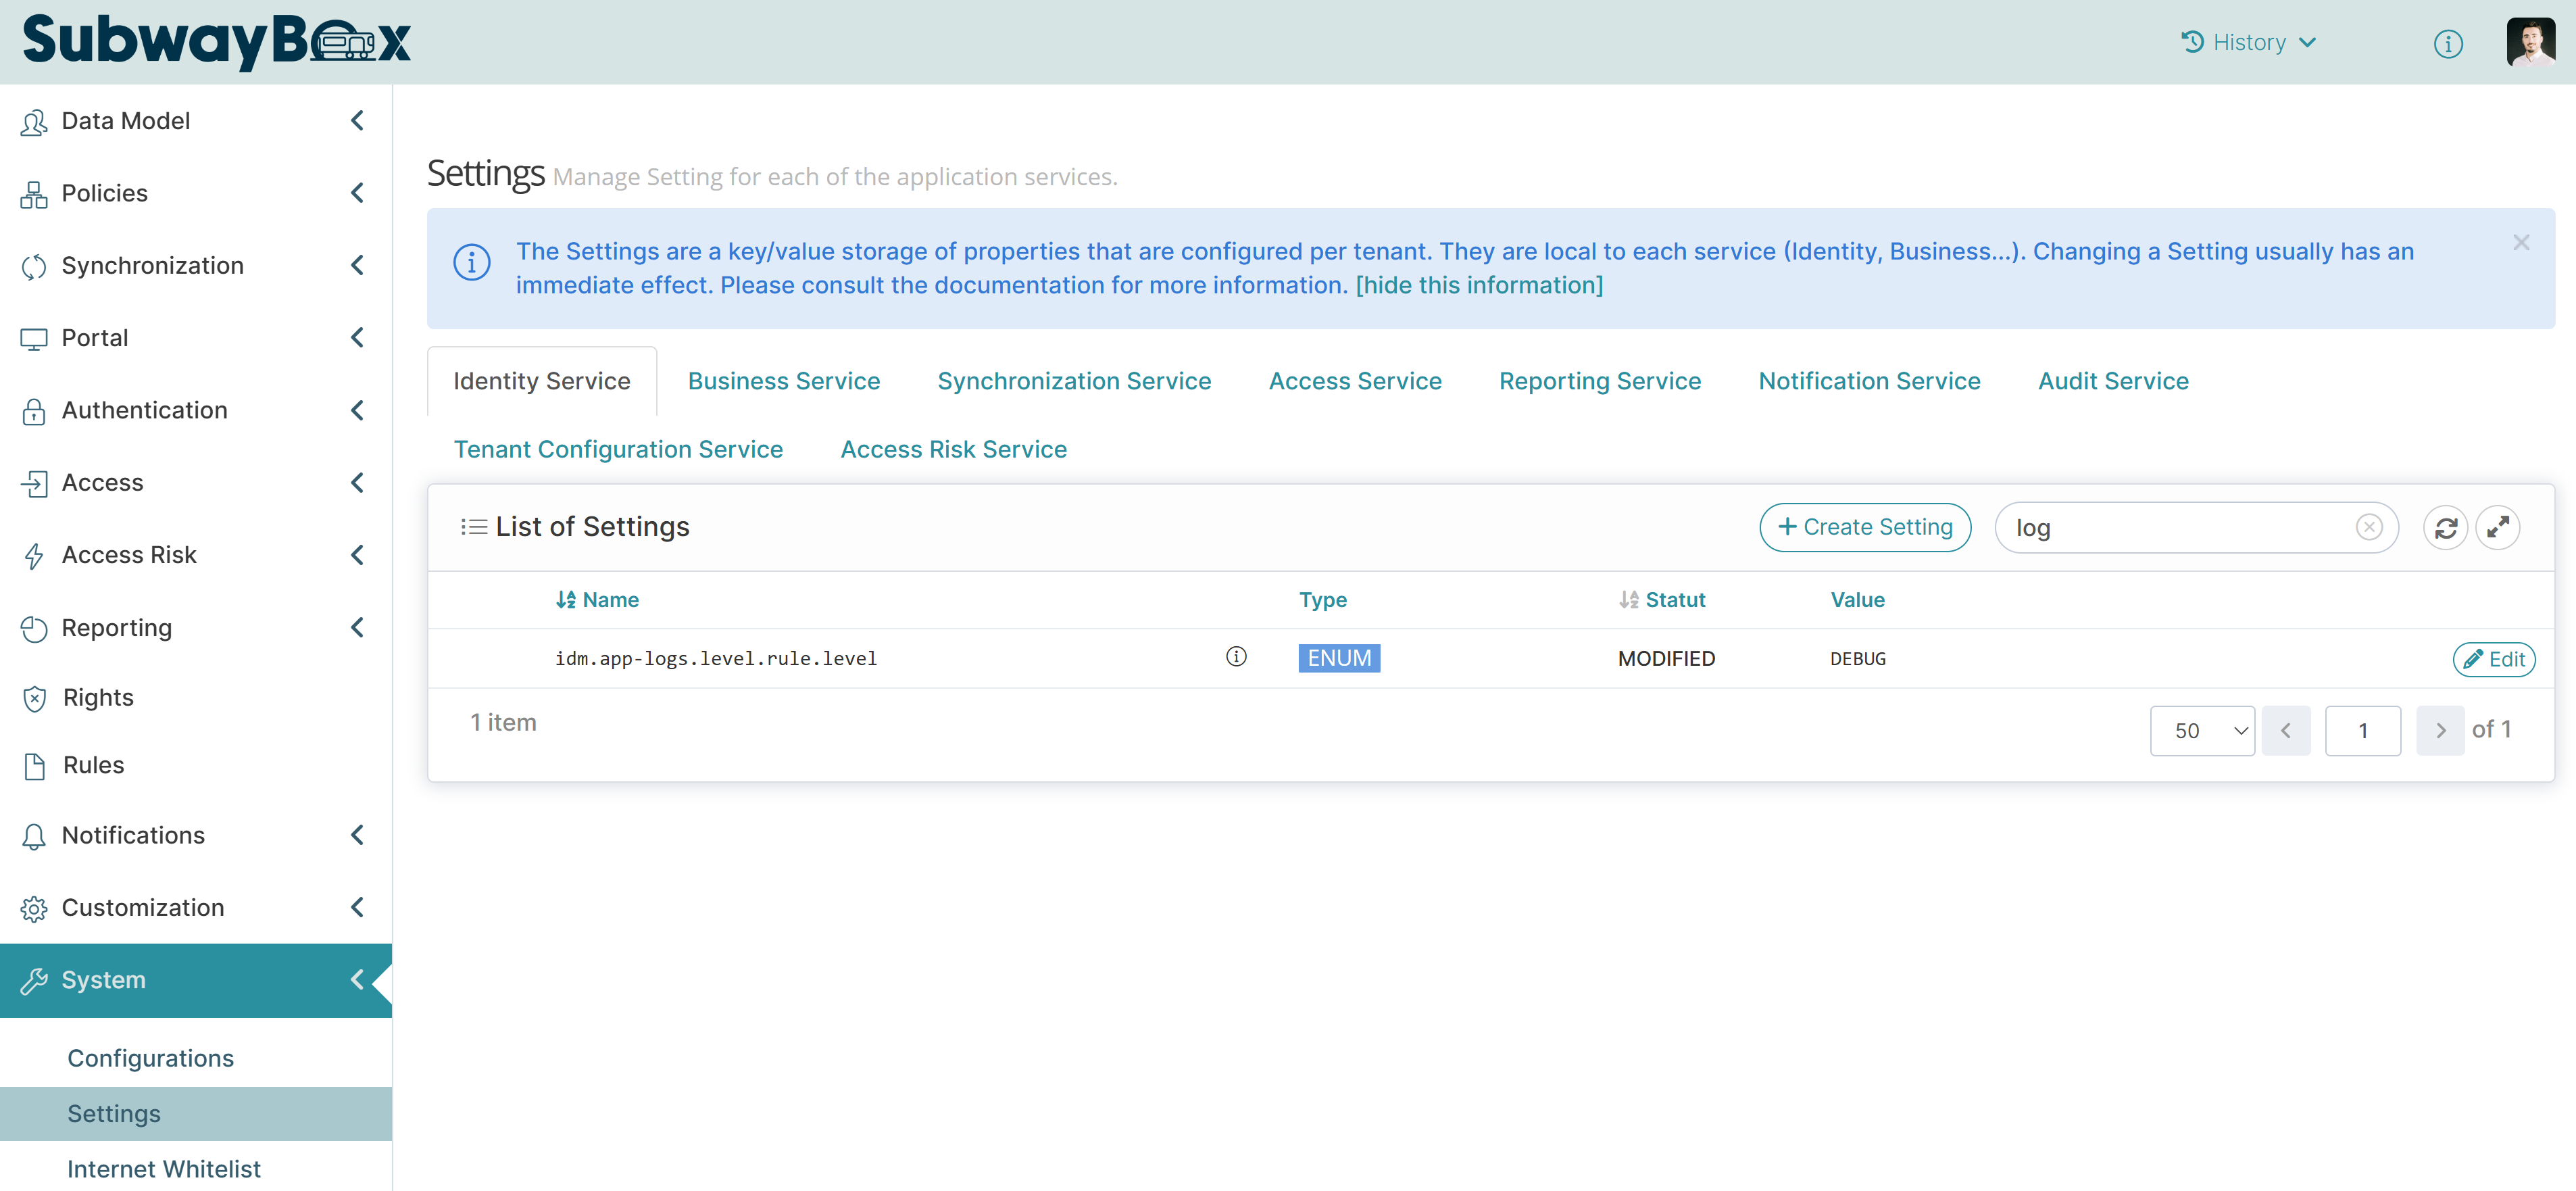
Log settings for an IDM service
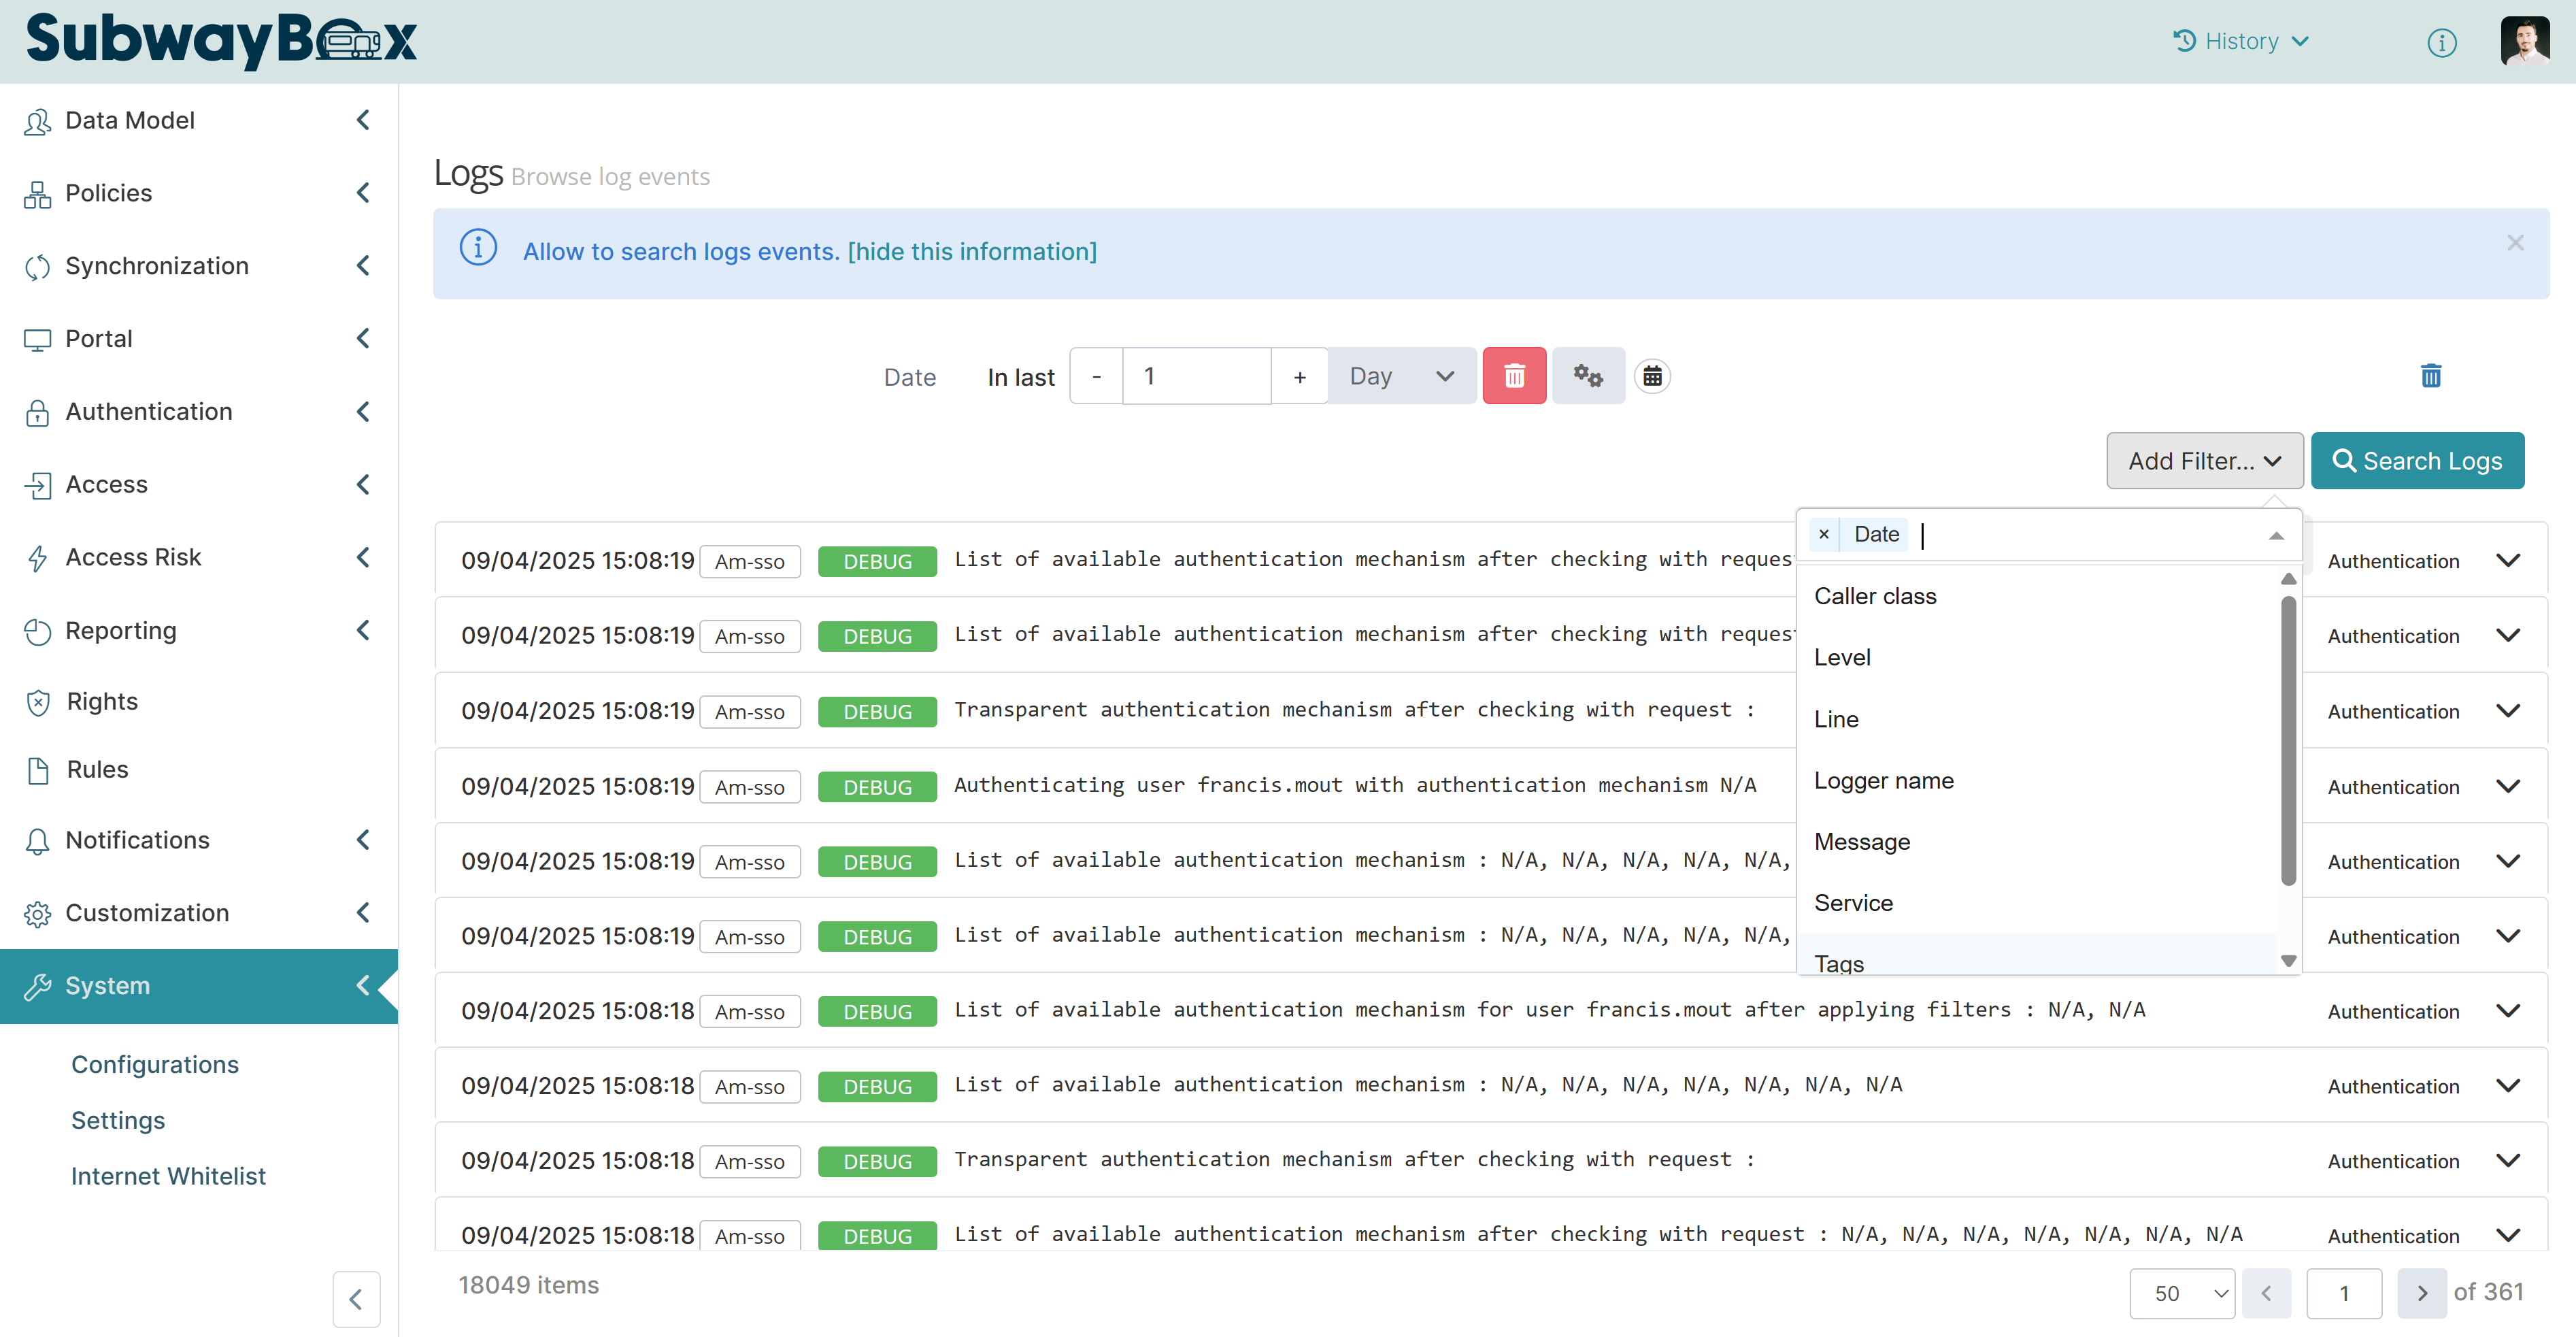
Access to the log feature
You can access the log feature from the Administration portal → System.
By default, the filter shows logs from the last day.
Filter
To find a log, apply filters. Memority combines all filters with a logical AND.
To add a filter:
Click Add Filter…
Select one or more filter types
Enter a value for each filter
The table below lists some useful filters and how to use them:
Filter | Format | Description | |
|---|---|---|---|
Date | Period | Choose a time frame for the filter. You can select a range (from seconds to years in the past) up to the current moment, or specify exact dates. | |
Date | Interval | To set a date interval, click the calendar button and choose the start and end dates. | |
Service | Service name | Select the service that generated the log (for example, IDM or BUM) to filter the results. | 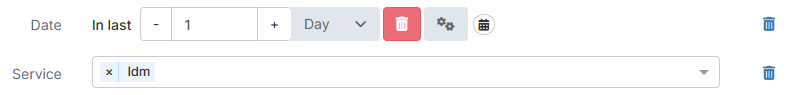 |
Tid | UUID | Enter the UUID of a tracking ID (for example, log ID or policy execution). Log IDs are especially useful because they link to an action context and connect all actions triggered by the initial action. | 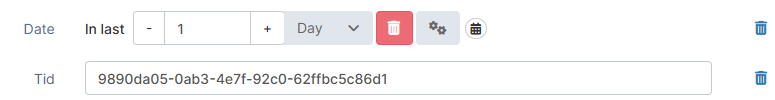 |
Message | String | Enter keywords to filter log messages. | 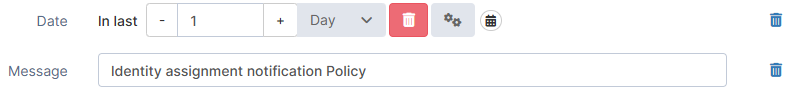 |
Information
Each log entry shows:
Message: The log message itself
Level: The log level
Service: The service that generated the log
Timestamp: Date and time of the log
Rule: The rule category and rule type that generated the log
Script line: The line in the script where the log was created
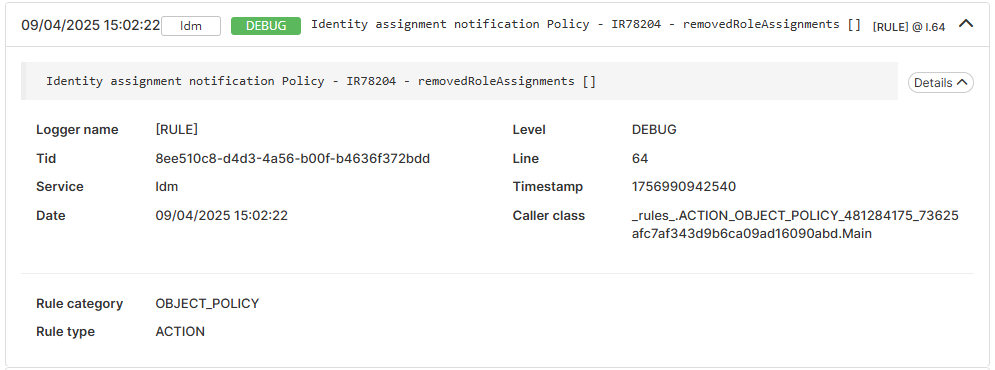
Example of log details