Along with the Reporting Service, the following widgets are provided to display Reporting Data in Features and User Tasks:
Reporting Widget: A general reporting widget that targets aggregation collection for the purpose of displaying graphs (bar graph, pie chart etc) and some custom graphs provided by the solution.
Reporting List: A list type reporting widget for the purpose of displaying paginated data.
"Associations" are used on the front end to connect different reporting widgets together. By "Associations" we mean that a widget will transfer its criteria values to another widget that also declare the same or other criteria.
The associations is a directed graph. There is a source and a target. The criteria can have a different name between the source and target and the association configuration will allow to remap the name of the source to the target.
There are a couple of rules to follow for the graph of associations:
While not forbidden, a cycle in the association will result in an infinite loop, a source widget will transfer to a target widget which will again trigger an association. The graph should be acyclic.
A target widget can have multiple parents. However in practice it is better to use a dedicated target widget for each source widget as it will remove the confusion in the UI on which parent the widget is currently showing the association.
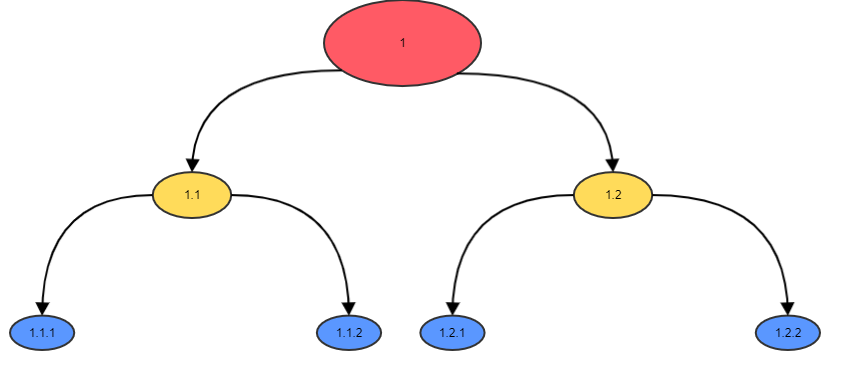
A widget that is a target but not a source widget is called a "Terminal Listener Widget" (TLW). TLW will be hidden if there is an association triggered that does not involve them. For instance, in the diagram below, if one trigger an association of the left yellow widget (1.1) to its target widgets (1.1.1 and 1.1.2), the blue widgets on the right (1.2.1 and 1.2.2) will be hidden since they are TLW that are not concerned by the associations (These are often list widgets). This behavior allows to only show the required TLW and remove confusion on the screen.
There are the options concerning the associations:
The "allowEditCriteria" boolean control the display of a criteria edition box on the target widget. If it is set to false, the transferred criteria will not be editable.
The "propagation" option allows to define a strategy on when should the association be triggered. For instance if we want the source widget to always transfer the criteria, the strategy to use is ALWAYS (default). It is also possible to constrain the association for when a "selection" happen in the charts (column click, slice click etc), this strategy is called SELECTION.
If the value to forward should be converted, the criteria mapping can declare a "conversion" configuration and provide a static value instead. In that case, the static value will be forwarded to the target instead of the value of the criteria in the source.
Below is an example of a typical organization of associated widgets:
Nested search
It is sometimes more convenient to provide, instead of a simple TEXT input for a criteria, a search widget for searching a criteria value.
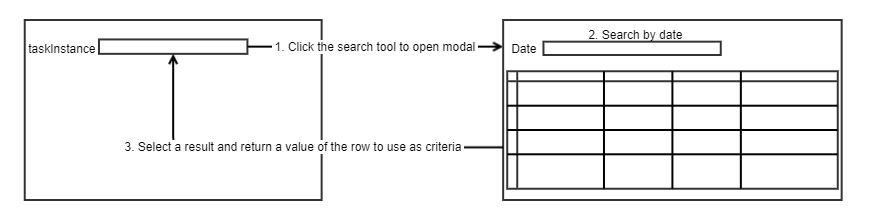
For instance, in the case of the SYNC_TASK_OPERATION collection, in order to visualize the sync operations it is important to select a taskInstance. The id of this taskInstance is however technical and automatically generated. In order to select the correct task instance the user can proceed in two steps:
Search for the different tasks in the collection SYNC_TASK_REPORT (using a date criteria for instance).
Select the desired task and use the value of its taskInstance field as the criteria value.
The configuration of this nested search is done at the criteria level. On the criteria taskInstance, the property reportingReferenceSearch is an object with the following properties:
reportingListWidget: An independant Reporting List Widget with a reportingId that targets the builtin collection SYNC_TASK_REPORT (or a custom collection to the same collection name). It also declares the criteria necessary for searching in this collection.
valuePath: The path to the value to use as criteria value on the parent widget. For instance if each row return something like { "taskInstance": "abcd123", "startDate": "2021-09-15T12:00:00Z" }, we want to return the value of the taskInstance field, thus the value path would be taskInstance(if the value is nested, a dotted path should be written).
i18n: The name of an i18n key that will have in its context the selected row. For instance to display the value in the field as "abcd123 (date: 09/15/2021)" one would write "tenant.ui.my.key" and provide the value "{ taskInstance } (date: { startDate, date, MM/DD/YYYY }"
Below is a sample of a reporting report that allows searching on task instance and display counters and sync operations.
syncReports is a reporting object configuration with the builtin collection SYNC_TASK_REPORT
syncOperations is a reporting object configuration with the builtin collection SYNC_TASK_OPERATION
syncReportsAggregation is a reporting object configuration with the builtin collection SYNC_TASK_REPORT_AGGREGATION
"tenant.reporting.data.value.GoogleChrome.label" = "Chrome browser has { value } usage representing { valuePercent }"
"tenant.reporting.data.value.FF.label" = "Firefox browser has { value } usage representing { valuePercent }"
Field operators
When using a series, a property must be referenced to indicate which field of the data is used for plotting the series. This property will often need to be transformed for the purpose of aggregating data. Let see some examples:
Date operators
In order to group elements by date granularity of hour, day, week, month and year, the REP service will add new fields that correspond to the chosen granularity during the aggregation phase. This granularity is specified by using one of "hour(field)", "day(field)", "week(field)", "month(field)" or "year(field)" where "field" is the name of an ISODate field in the Mongo collection. The field will be projected in the REP response as a camelized string consisting of the property and operator stripped of any dot:
hour(date) : group by hours. Targets the field "date". The response property will be "_dateHour".
day(date) : group by days. Targets the field "date". The response property will be "_dateDay".
week(date) : group by weeks. Targets the field "date". The response property will be "_dateWeek".
month(date) : group by months. Targets the field "date". The response property will be "_dateMonth".
year(date) : group by years. Targets the field "date". The response property will be "_dateYear".
Aggregation operators
The Y axis of an XY chart will often be used for displaying aggregated values. The aggregation is done using an operator:
sum(nb) for the sum over the field "nb" in the group
avg(nb) for the average over the field "nb" in the group
count() for the count of elements in the group.
count(field1, field2) for a distinct count over the provided list of fields (note that when doing a distinct count, no other groups or aggregates will be allowed).
min(nb) for the minimum of the field "nb" in the group
max(nb) for the maximum of the field "nb" in the group